Dec 15, 2025
Ultimate Guide to A/B Testing Donation Pages
A/B testing helps nonprofits improve donation pages by comparing two versions to see which performs better. Even small changes - like simplifying forms or tweaking donation amounts - can increase donations. Here's what you need to know:
- Key Metrics: Focus on conversion rates, average donation size, and recurring donations.
- Single Changes: Test one element at a time (e.g., form length, button text) for clear results.
- Tools: Use platforms like Google Analytics and donation software with A/B testing features.
- Low Traffic Tip: If your donation page has limited visitors, test higher-traffic areas like email campaigns first.
- Success Example: A nonprofit added a recurring giving pop-up and gained 100 new monthly donors.
Start with clear goals, track meaningful metrics, and test consistently to improve results. Simple tweaks can lead to measurable improvements in donations and donor engagement.
Key Elements of Effective A/B Testing
Core Concepts of A/B Testing
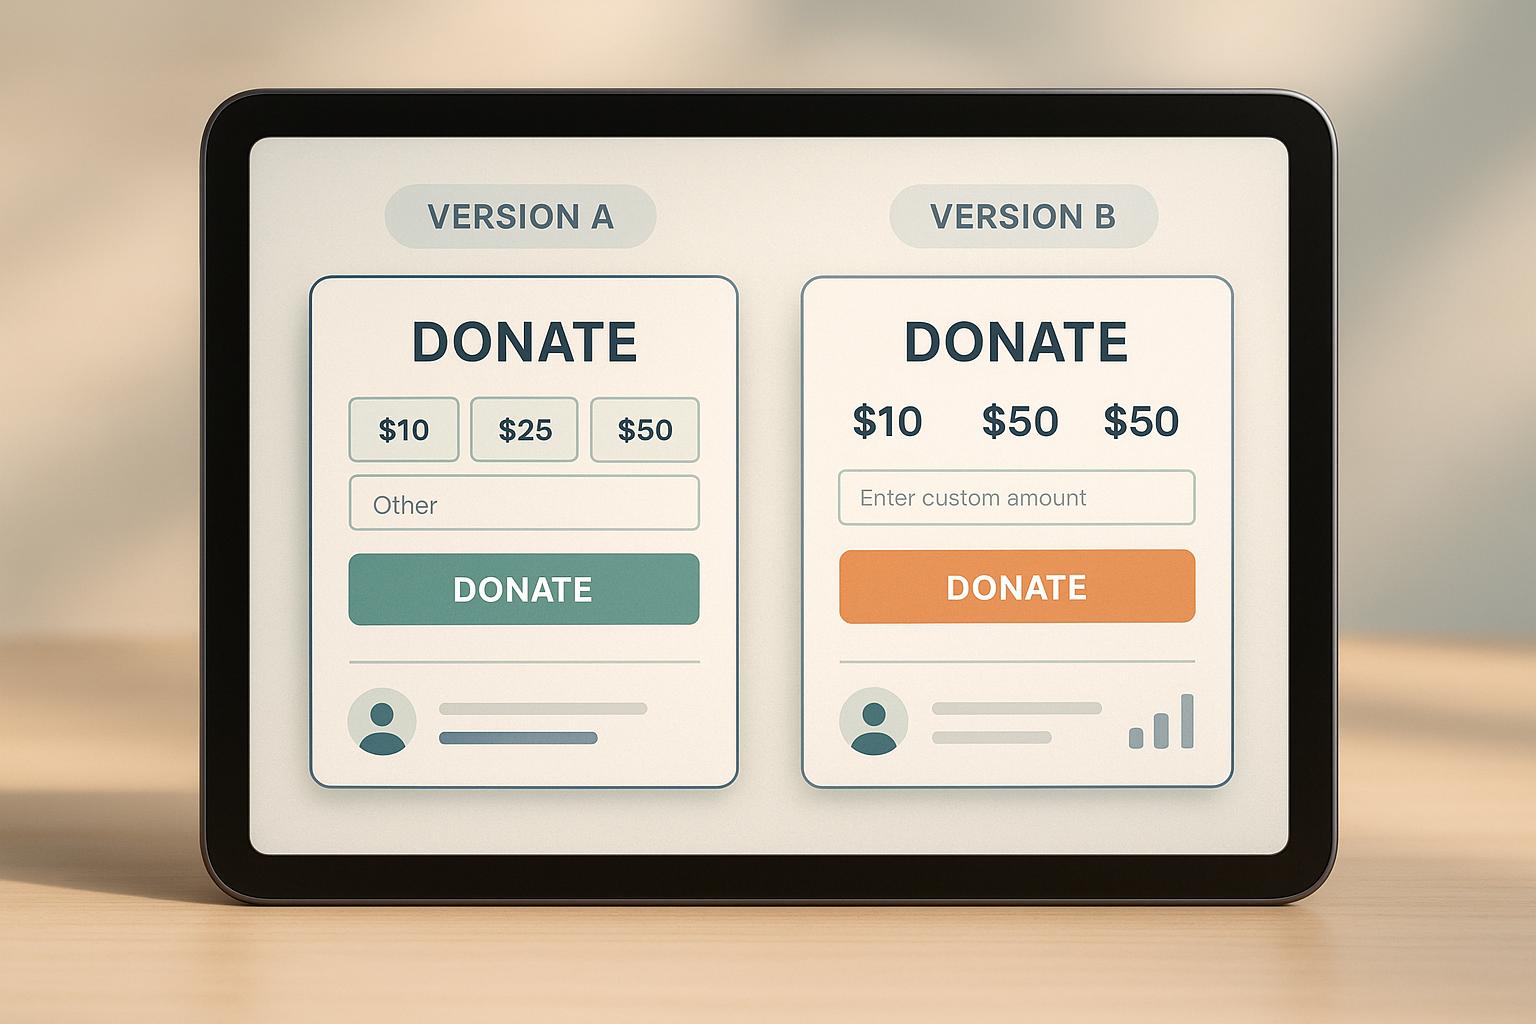
A/B testing is all about comparing two versions of the same donation experience to determine which one performs better. Typically, your current page serves as the control (Version A), while the updated version acts as the variant (Version B). Visitors are randomly assigned to one of these versions, ensuring an unbiased comparison between similar groups.
The cornerstone of A/B testing is single-variable testing - changing only one key element at a time. For instance, you might adjust suggested gift amounts or modify button text. This way, any performance differences can be directly tied to that specific change. Keeping the focus this narrow is especially important for accurate results. To ensure reliable outcomes, plan your test with a sufficient sample size, aim for a 90–95% confidence level, and run it long enough to capture typical traffic patterns.
Once you’ve nailed down these basics, confirm that your technical setup is ready to support the test.
Prerequisites for A/B Testing
Before diving into your first test, there are a few must-haves to get in place. Start with an analytics tool, such as Google Analytics 4, to track key metrics like sessions, donations, conversion rates, and revenue for each page version. Be sure to set up goals or events that measure actual donations - such as tracking thank-you page visits or form submissions - so you’re focusing on meaningful outcomes, not just clicks.
You’ll also need a system to create and serve two versions of your donation page. This could involve using built-in A/B testing tools or even manual splits if necessary. Assign clear roles: marketing teams can handle test setup and traffic allocation, while fundraising teams define success criteria and ensure the messaging aligns with your brand. Don’t forget to maintain clean data practices by using consistent campaign names and UTM parameters. This will make it easier to link results back to specific tests.
If your nonprofit has limited traffic - say, only a few dozen completed donations per month - consider starting with tests on earlier-funnel assets like email subject lines or landing page calls-to-action. These areas often have larger audiences and can yield insights more quickly. For donation pages with very low traffic, focus on big, impactful changes like simplifying forms, clarifying your value proposition, or offering more straightforward giving options, rather than small tweaks like adjusting colors.
Primary Metrics to Track
To make informed decisions, track a few key metrics during every test. The conversion rate - the percentage of visitors who complete a donation - reveals how effectively your page turns interest into action. The average donation amount helps you see if changes influence the size of gifts; for example, a variant might slightly lower the conversion rate but increase the average donation size, ultimately boosting total revenue. By monitoring both conversion rates and donation amounts, you’ll get a clearer picture of overall performance. Additionally, track ARPU (average revenue per user) to capture the combined effect of conversion rates and donation sizes.
Pay attention to the rate of recurring donations, which measures how many donors opt for monthly or ongoing contributions. This is vital for ensuring long-term financial stability. Lastly, keep an eye on the form abandonment rate, which shows the percentage of visitors who start the donation process but don’t complete it. High abandonment rates often point to issues like confusion, friction, or lack of trust.
Before running a test, decide on your primary success metric - whether it’s total revenue, conversion rate, or something else - based on your campaign goals. This clarity will help you define what success looks like from the start.
21 Elements to A/B Test on Your Donation Page
Step-by-Step Process for A/B Testing Donation Pages
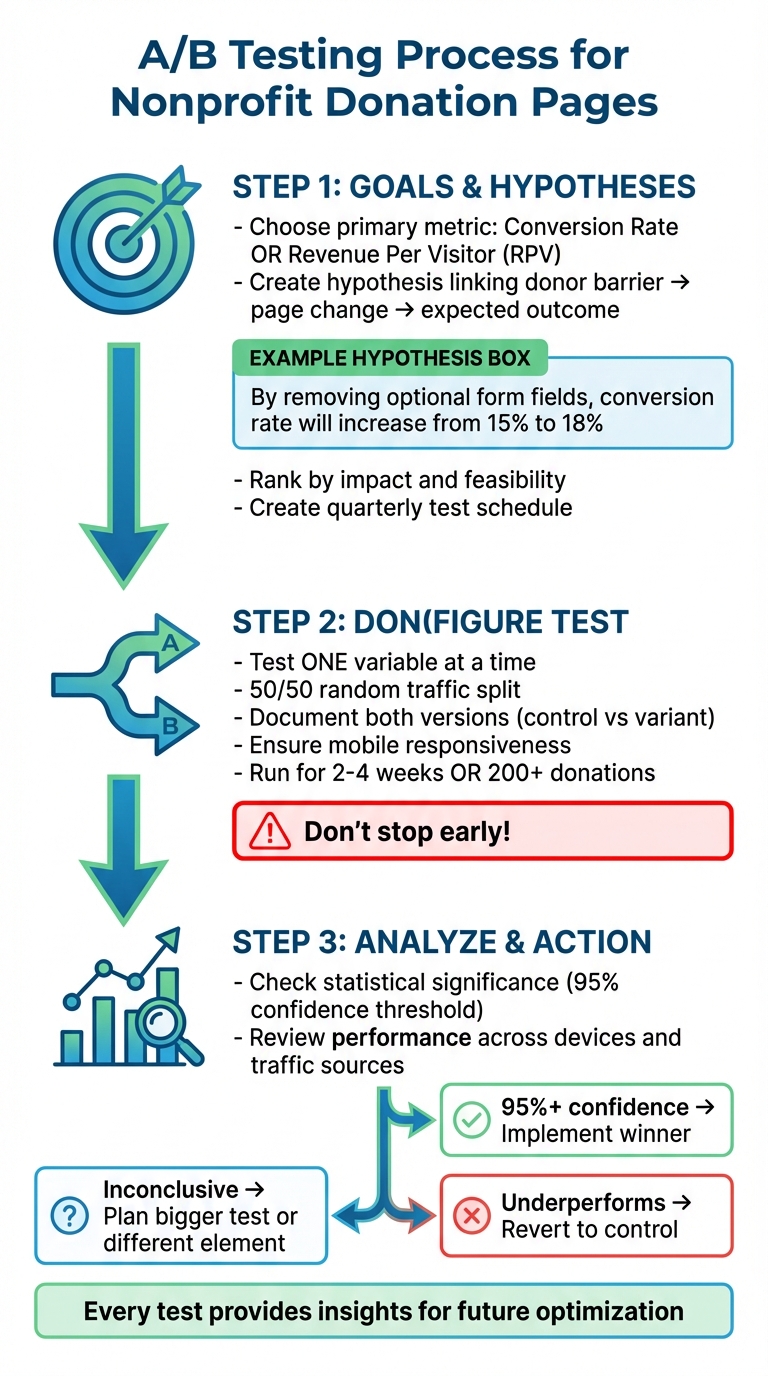
A/B Testing Process for Nonprofit Donation Pages: 3-Step Framework
Define Clear Goals and Hypotheses
Start by deciding on one primary metric to guide your test - either donation conversion rate or revenue per visitor (RPV) in USD. If your goal is to grow your donor base, focus on the donation conversion rate, which measures the percentage of visitors who complete a donation. On the other hand, if maximizing revenue is your priority, track revenue per visitor (RPV), calculated to at least two decimal places (e.g., $3.47 per visitor). Keeping the focus on a single metric ensures clarity and avoids confusion, such as one version generating more clicks but fewer actual donations.
Next, craft a hypothesis that connects a specific donor barrier to a measurable change on your page. For instance: "By simplifying the donation process for first-time donors and removing optional form fields like 'How did you hear about us?', we expect the donation conversion rate on the main giving page to increase from 15% to 18%." Another example might be: "By using specific dollar amounts to show impact in the ask ladder (e.g., '$50 provides school supplies for 5 students'), revenue per visitor will increase." A solid hypothesis should name the audience, outline the change being tested, and predict the expected outcome.
Once hypotheses are ready, rank them by potential impact and feasibility. Assign scores based on expected lift and effort required, then assess whether your donation page gets enough U.S.-based traffic to produce reliable results. If traffic is limited, consider testing elements earlier in the funnel, such as email subject lines or homepage calls-to-action. Create a quarterly schedule that includes one live test per traffic stream at a time, with clear start and end dates (in mm/dd/yyyy format), the primary metric, and a documented decision rule.
With your goals and hypotheses in place, it’s time to configure your test to focus on these changes.
Design and Configure Your Test
For accurate results, test only one variable at a time between your control and variant. This could include changes to form length, headline text, suggested donation amounts, or the placement of trust indicators. The control remains unchanged, while the variant incorporates the specific adjustment you're testing - such as removing two optional fields or changing the hero image. Be sure to document both versions with screenshots, text (including ask strings in USD), layout details, and technical settings.
Set up a 50/50 random traffic split to ensure both versions receive equal and unbiased visitor volumes. Make sure both versions are fully mobile responsive, as many U.S. donors prefer giving via smartphones. Test the pages on popular devices and browsers, and double-check that payment options like credit cards and digital wallets function correctly for both versions. Run the test for a full cycle, typically 2–4 weeks, or until you collect at least 200 donations. Resist the urge to stop early just because one version appears to lead after a few days - this can result in inaccurate conclusions.
Analyze Results and Take Action
After your test ends, analyze the results carefully. Use built-in tools or online calculators to check for statistical significance. Enter the number of visitors and conversions for each version to determine if the results meet the 95% confidence threshold. If the difference is small or confidence is below 95%, consider the test inconclusive and avoid rolling out the variant broadly. Also, review performance across devices and traffic sources to identify any specific trends or opportunities.
If one version achieves 95%+ confidence, implement it as the new standard. If the variant underperforms, revert to the control and document what didn’t work. For inconclusive results, evaluate whether the test lacked enough traffic or if the change was too minor. In such cases, consider a more impactful follow-up test or focus on a different element entirely. Remember, every test - whether successful or not - should provide insights to guide future optimization efforts. Treat this as an ongoing, iterative process rather than a one-time task.
sbb-itb-deea482
High-Impact Donation Page Elements to Test
Once you've established your testing strategies, it's time to focus on the specific elements of your donation page that can directly influence donor behavior.
Page Layout and Form Design
The structure of your donation form plays a big role in whether donors complete their contributions. For instance, multi-step forms guide users through smaller steps - like entering contact details first, then payment information, and finally confirming the donation. On the other hand, single-step forms present all the fields at once. Testing both approaches can reveal which one works better for your audience.
Evaluate the necessity of each field on your form. Try removing some fields or making them optional to see if it improves completion rates. Experiment with preset donation buttons in different positions on the page, and test "ask ladders" (preset donation amounts) in ascending versus descending order. You could even adjust preset amounts to be slightly higher - say 10% more - to see if it increases the average gift without reducing conversion rates.
For example, a nonprofit working with Share Services tested adding a recurring giving pop-up and gained nearly 100 new monthly donors. This shows how small tweaks to your form design can lead to meaningful results.
Once your layout is optimized, the next focus should be on refining your messaging to better connect with donors.
Messaging and Copy
The language on your donation page - especially in headlines and appeal text - sets the tone for the entire experience. Compare emotional appeals with factual statements to see which resonates more. For example, test calls-to-action like "Join us" versus "Help now." You might also experiment with storytelling that highlights donor impact, such as "$50 provides school supplies for 5 students", rather than simply stating, "$50 supports our education program."
Button text is another area worth testing. Options like "Donate", "Give Monthly", or "Make an Impact" can evoke different responses. According to Share Services, a compelling and clear story can lead to more donor engagement and greater support for your mission. You can also test different tones - formal versus conversational - and perspectives, such as directly addressing the donor versus using third-person narratives, to discover what resonates best with your audience.
Once your layout and messaging are working together, the next step is to build trust with potential donors.
Trust Indicators and Social Proof
Before donating, many people look for assurance that their contributions will be used effectively. Adding elements like financial transparency - such as a statement like "90% of donations go directly to programs" or a visual progress bar showing campaign goals - can help instill confidence. Test whether prominently featuring these elements improves your conversion rates compared to pages without them.
Social proof is another powerful tool. Donor testimonials, security badges from payment processors, and impact statistics can all make a difference. For instance, you could test including donor quotes versus leaving them out, or try adding a totalizer - an interactive feature that shows real-time donation progress. This can encourage more people to contribute or even inspire larger gifts.
Tools and Support for A/B Testing Donation Pages
A/B Testing Tools
Many major donation platforms come with built-in A/B testing features, so you don’t always need extra software to get started. Platforms like Blackbaud, ActBlue, and Fundraise Up allow you to create multiple versions of your donation forms, automatically split traffic between them, and track fundraising metrics like conversion rates, total donations raised, and average gift size - all in U.S. dollars.
To complement these tools, Google Analytics can help monitor key metrics such as sessions, bounce rates, and revenue per visitor. Meanwhile, UX tools like heatmaps and session recordings can highlight where visitors drop off or which form fields might be causing frustration. These insights can help you craft better hypotheses before launching an official test.
Together, these tools provide a strong foundation for building and refining your testing strategy.
Evaluating Readiness for Testing
Before diving into A/B testing, it’s important to ensure your organization has the right conditions in place. First, estimate the monthly traffic to your donation page - low visitor numbers can make it harder to reach statistically significant results quickly. If traffic is limited, consider testing higher-traffic assets like fundraising emails instead.
You’ll also need baseline metrics to measure success effectively. Make sure you’ve documented current performance data like conversion rates and average donation amounts. Assign clear roles for planning, execution, and analysis. In smaller teams, one person might handle multiple responsibilities, but it’s crucial to run tests long enough and keep detailed records of hypotheses, variations, dates, and results. This way, you can build on your learnings over time.
Once you’ve established a solid testing framework, expert support can make the process even smoother.
How Share Services Supports Nonprofits
For nonprofits generating $1–$20 million in annual revenue, Share Services offers specialized support for A/B testing and donation page optimization. Their process begins with an audit of your digital fundraising tools - covering your donation platform, CRM, analytics, and email systems - to identify existing A/B testing capabilities and any gaps. With their expertise in digital fundraising, donor retention, and acquisition, they can develop a tailored roadmap to align with your goals, whether that’s converting first-time donors or encouraging recurring gifts.
One example of their success: Share Services worked with an Advancement Department to test simplified messaging, which significantly boosted conversion rates. They also introduced a recurring giving pop-up that added nearly 100 new monthly donors and implemented paid display ad retargeting, which delivered strong results across other campaigns as well.
"If I was actually doing this project, it would have taken me half a year, and Share was able to do it in a couple of months. And that's something we wouldn't have been able to do with our small staff." - Kyle Birch, Director of Communications
Beyond individual tests, Share Services can help nonprofits establish a testing calendar tied to major campaigns, such as year-end appeals. They also ensure consistent tracking across all test variations and train in-house teams to interpret results and apply winning strategies to future campaigns. With structured packages that include strategy development, dedicated management, and KPI reporting, Share Services helps nonprofits move beyond one-off experiments toward a sustainable, optimization-focused approach.
Conclusion: Building a Culture of Optimization
A/B testing isn’t just a one-and-done task - it’s an ongoing process that helps improve digital fundraising efforts over time. Every test, whether it’s a hit or a miss, provides valuable insights that guide your next move. Organizations that commit to this continuous cycle of testing and refining often see steady improvements in conversion rates, average donation amounts, and recurring contributions. By consistently forming hypotheses, testing small adjustments, and implementing what works, you’ll create a fundraising strategy built on data rather than guesswork.
Even smaller nonprofits can get started by testing things like headlines, adjusting suggested donation amounts, or simplifying forms by removing optional fields. These small tweaks add up. Research from NextAfter, which has analyzed thousands of nonprofit experiments, shows that focusing on reducing friction and clarifying value can lead to conversion rate increases of 10–40% per test. Similarly, Fundraise Up has reported that consistent testing and optimization can double digital revenue over time by improving both conversion rates and average gift sizes.
To make this mindset part of your organization’s culture, set a goal like conducting at least one meaningful test each month. Create a testing roadmap for the next six to twelve months, hold regular review meetings to analyze results, and document your findings in a shared log. Celebrate the small wins to encourage your team to keep experimenting, and view tests that don’t succeed as opportunities to refine your approach.
For organizations with more resources, scaling these efforts is entirely possible. Nonprofits with annual revenues between $1 million and $20 million can turn to Share Services for expert support. Their team can audit your current tools, develop customized testing plans, and train your staff to interpret and act on results. With options like strategy retainers starting at $3,500 per month and project-based services at $3,000 per month, Share Services provides structured packages that include strategy development, management, and detailed KPI reporting. This type of support can help move your organization beyond occasional experiments toward a fully integrated, data-driven approach.
In today’s competitive fundraising landscape, ongoing optimization ensures your message connects with the right audience and makes the most of every donor dollar. By embedding A/B testing into your strategy, you’ll not only improve donor experiences but also boost long-term revenue and create a more stable foundation for the work your organization is doing to make a difference.
FAQs
What are the benefits of A/B testing for improving donation page performance?
A/B testing empowers nonprofits to fine-tune their donation pages by identifying which design elements, messages, or user experience features strike a chord with donors. This method, grounded in data, helps organizations make smarter decisions to improve engagement and drive more contributions.
For instance, testing factors like headline phrasing, button colors, or the length of forms can reveal what works best. These insights allow nonprofits to create pages that resonate more deeply with their audience, ultimately inspiring greater support.
What are the first elements I should test on my donation page?
Start by focusing on the elements that have a direct impact on donor engagement and conversion rates. These include the headline, suggested donation amounts, call-to-action (CTA) buttons, and the layout of the donation form. Even small tweaks in these areas can enhance the overall experience and motivate more people to contribute.
For instance, you could test different headlines to find out which one connects best with your audience. Adjusting the suggested donation amounts to align with typical giving patterns can also make a noticeable difference. Similarly, experimenting with the placement, color, or wording of your CTA buttons can significantly influence donor action. To get clear insights, focus on testing one element at a time and see what drives the best results for your organization.
What should I do if my donation page doesn’t get much traffic for A/B testing?
If your donation page isn't seeing much traffic, there are still ways to gather useful insights. One option is to extend the testing period, allowing more time to collect data. Another approach is to group similar low-traffic pages into a single test, which can help boost your sample size. You might also explore sequential testing methods or multivariate testing to make the most of limited traffic while pinpointing changes that matter. Prioritize testing key elements, like suggested donation amounts or call-to-action buttons, to ensure your efforts lead to meaningful results.
Related Blog Posts
Get helpful resources, straight to your inbox
We love sharing tools, ideas, and stories that make nonprofit work a little lighter and a lot more effective. Sign up below and we’ll send you practical tips, free resources, and a bit of encouragement—because the work you’re doing matters.
No spam. Just good stuff for good people.